¶ PVYapplytics

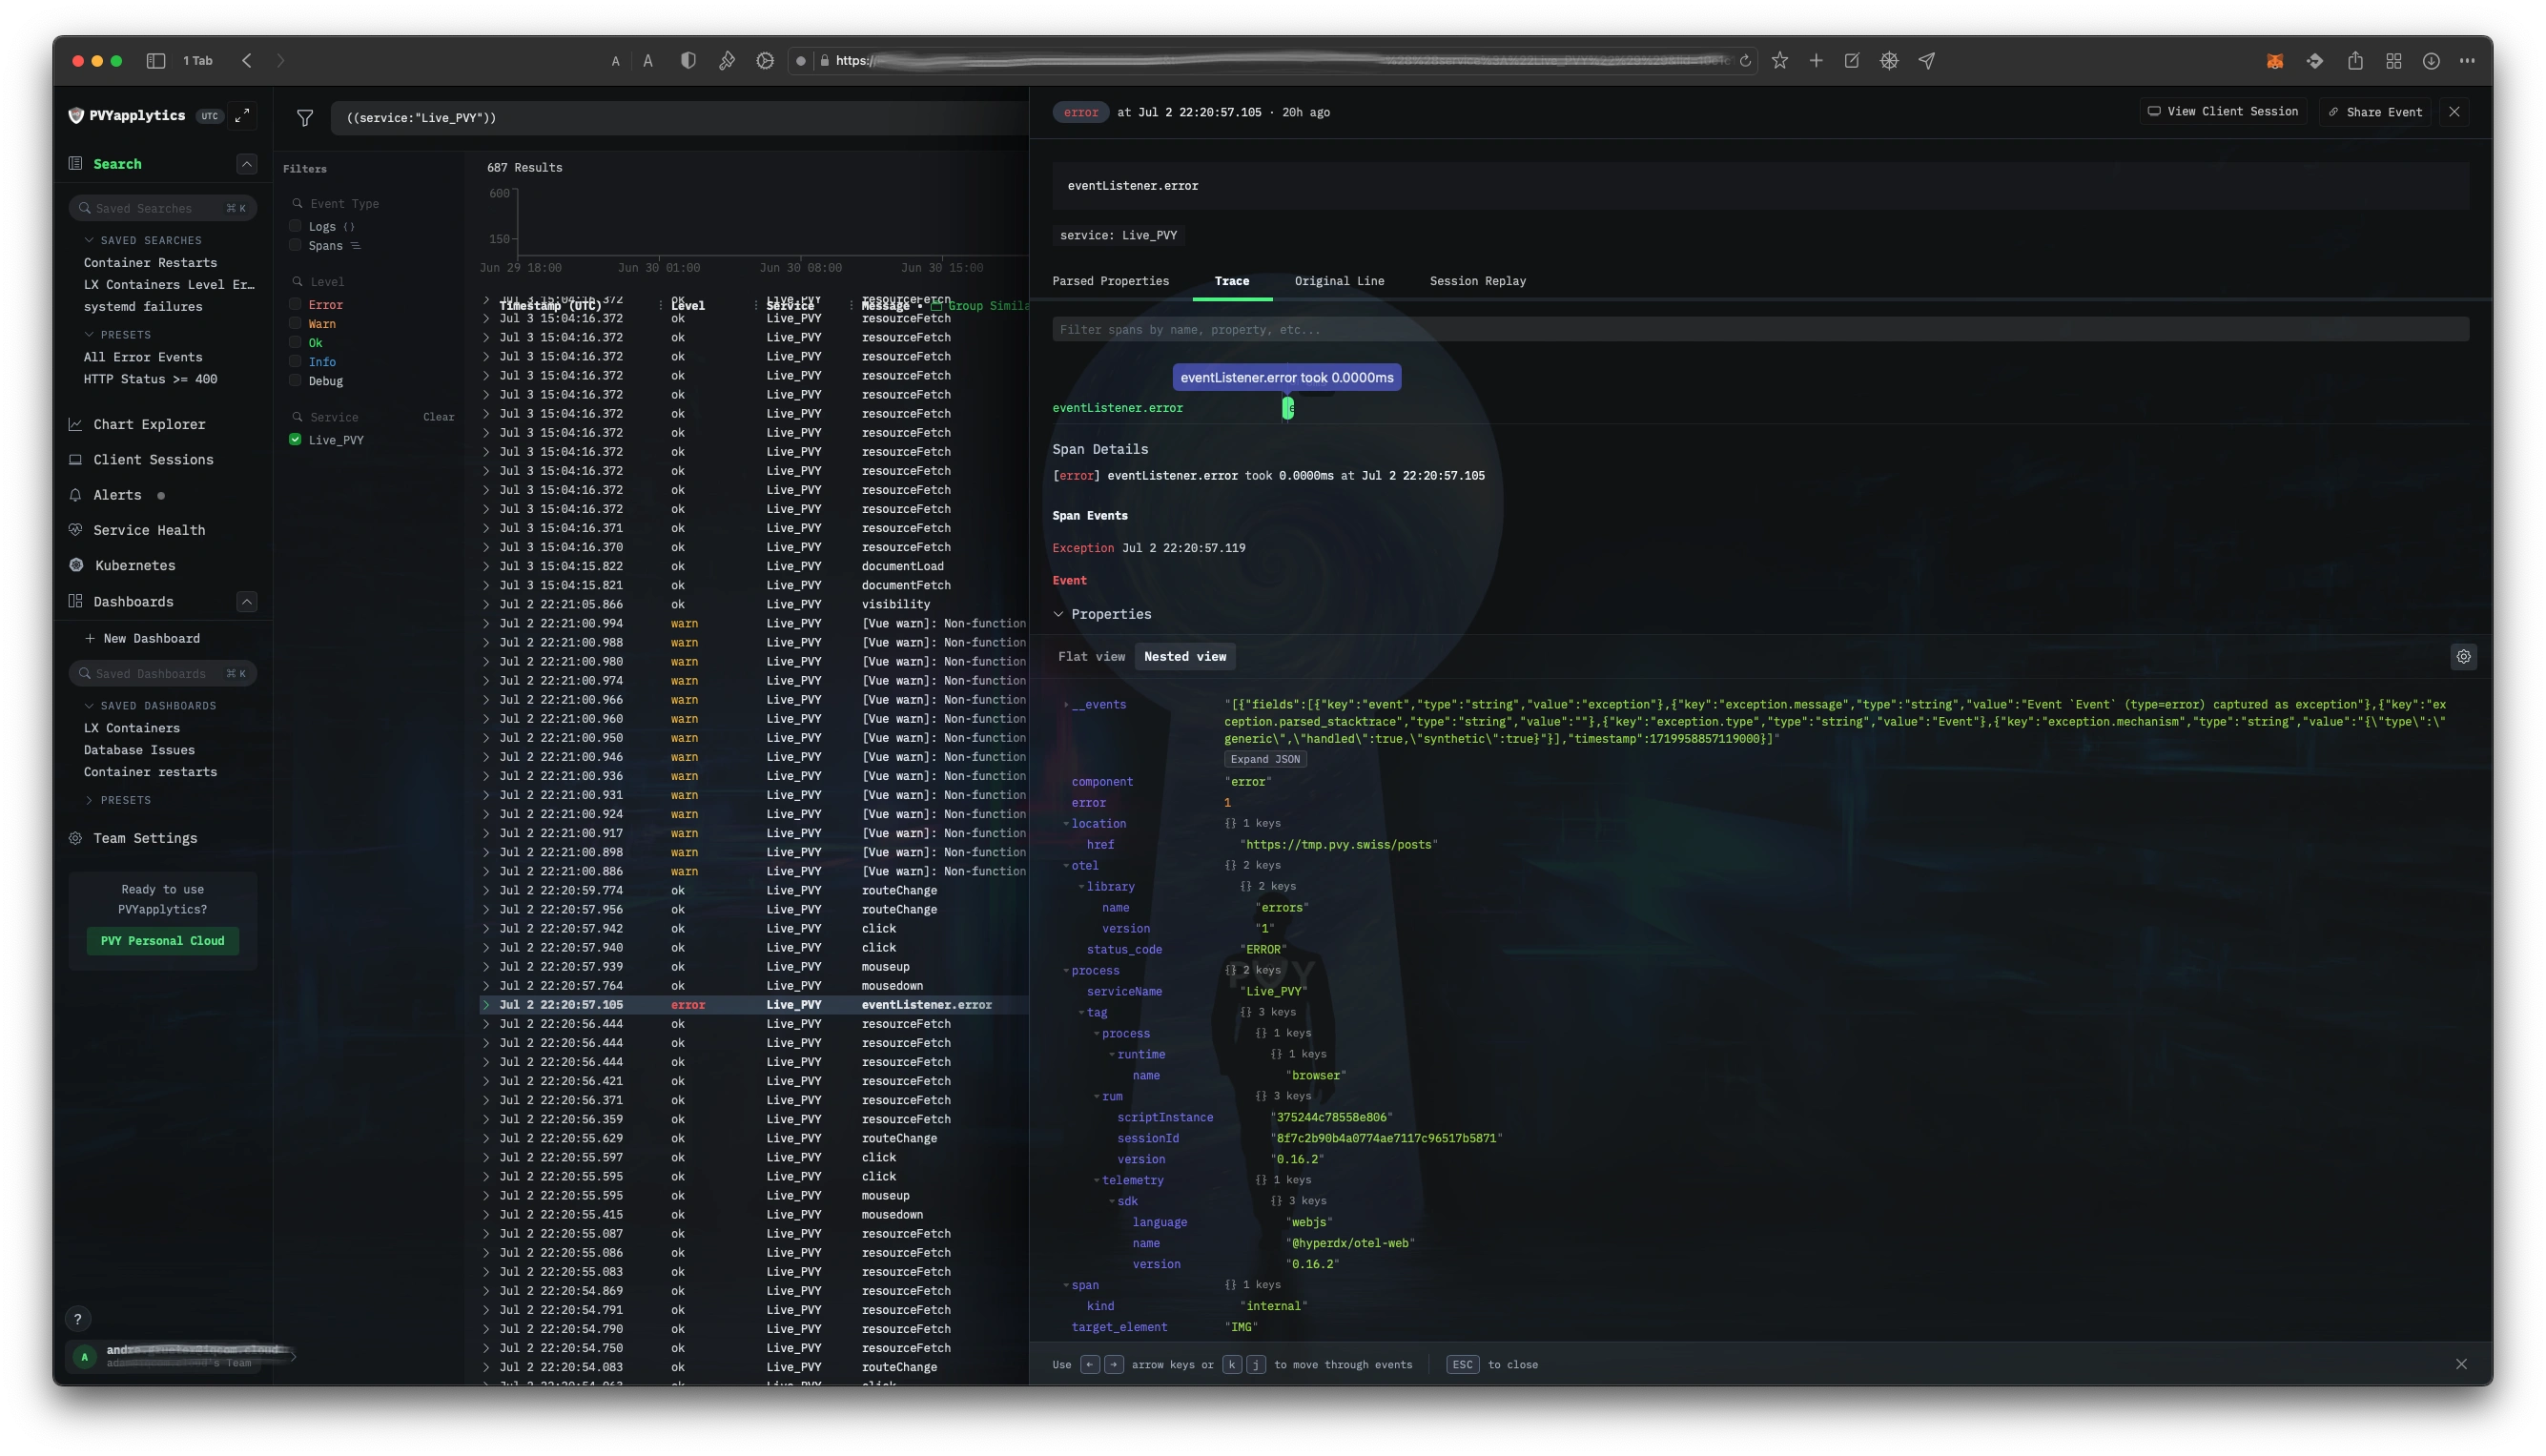
PVYapplytics, availabe on the PVYappstore to run on your PVY@Cloud Deployer Stack or on PVY@Office Appliance, is a development to production monitoring & debugging tool that allows you to correlate logs, traces, and user sessions all in one place. And it does that automatic for you, based on what SDKs you include into your environment.
You can debug complex errors and user issues all in one platform, without needing to jump between multiple tools and correlate using timestamps and manual correlation ids. There is no need to write “grok-patterns” or split upstreams to get started.
Coverage:
- Logs
- Spans
- Traces
- Database
- Code
- Infrastructure (Baremetal, Kubernetes, Cloud Env)
It’s native search utilize the tech stack behind, clockhouse db, allows you to do full-text search across all your events, without the requirement to think and search with complex syntax. But you can.
It support the vendor neutral “Open Telemtry” out of the box, so you can instrument your application to send logs and traces to PVYapplytics, where you can search and visualize your telemetry data on the fly within an intelligent user design.
Open Telemetry can further used with SDK’s to implement into your projects, metrics can be read and filtered in real time and you have basic rule set such as 99%; 95% 90% percentiles rulesets included so you can quickly go live to create alerts, send by mail, PVYmessenger, Webhooks or over tokenized API to PVYautomat or somewhere else.
On top of that, several platforms are being supported with little effort to get your data searchable and of course also deployment infrastructure such as Heroku, Kubernetes, Cloudflare, PVYflare, Docker/Docker Compose.

¶ Live updating Dashboards
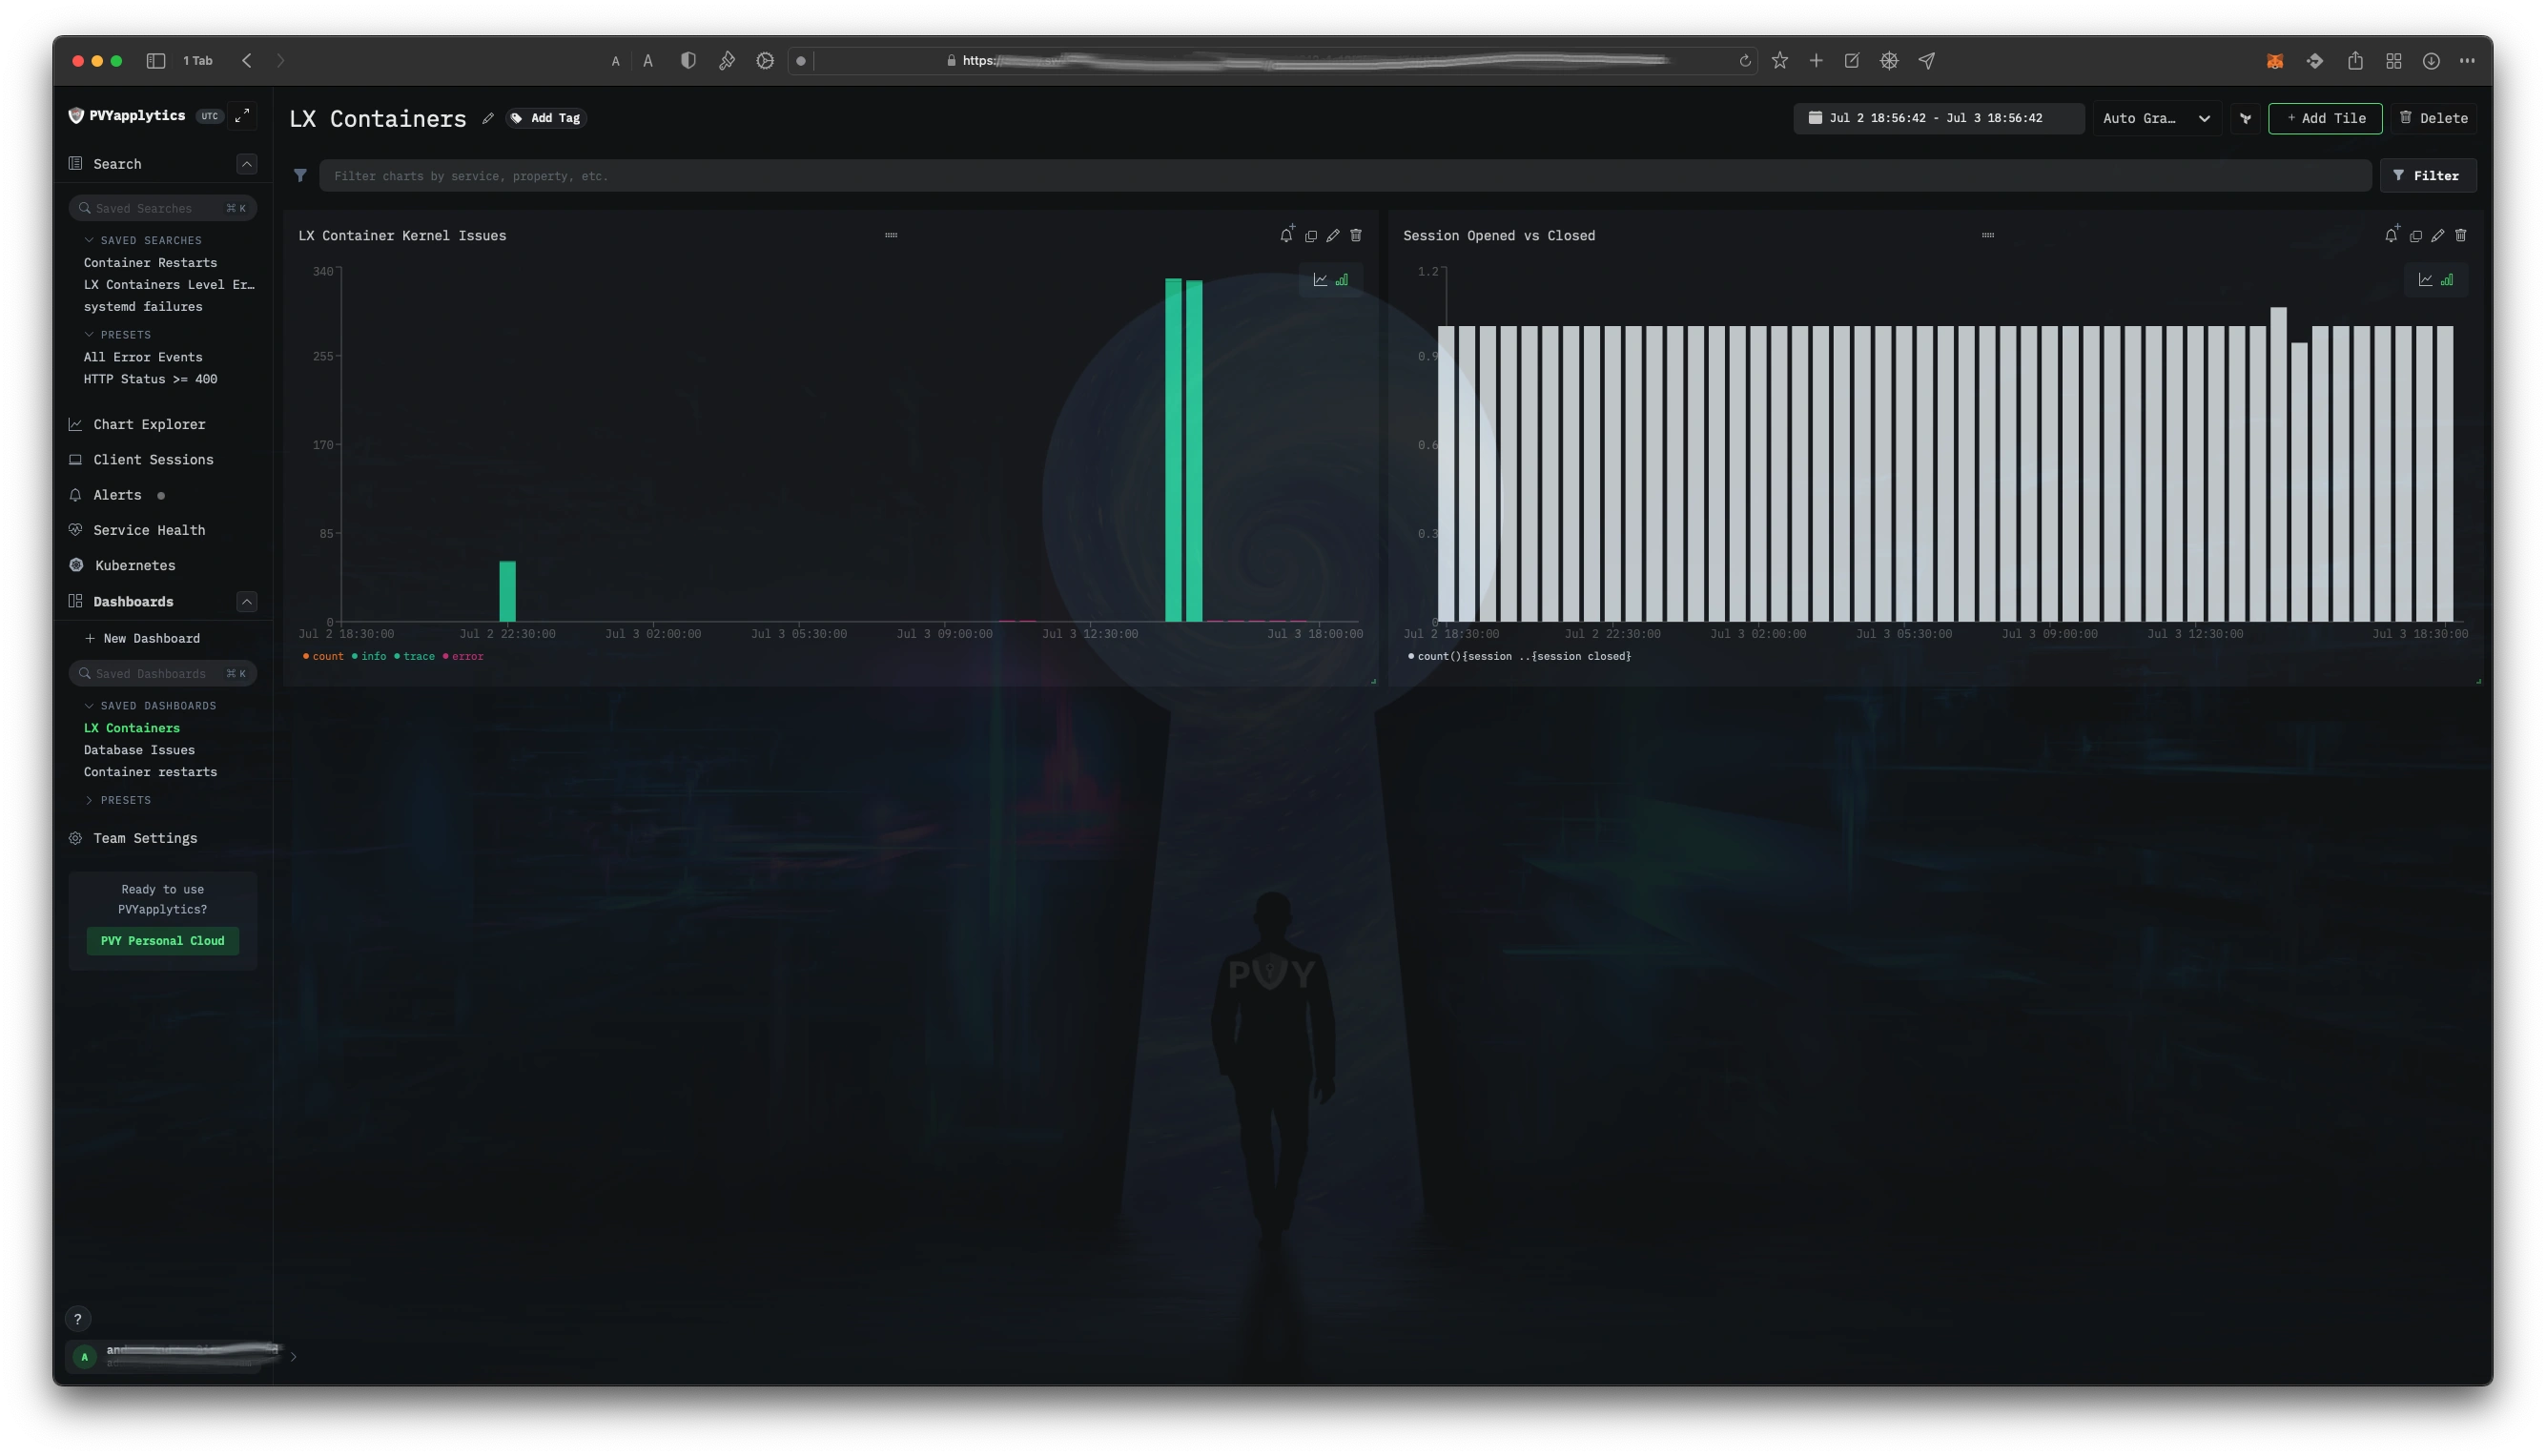
From adhoc searches or saved searches, you can create live updating Dashboards with just a few clicks, which gives your Orchestrators and Software Developers meaningful insights.
¶ Refine search with a click out of parsed logs
Quickly add by a fingertip other values parsed out from your logs to narrov similarities down at glance.
¶ Session Replay & Service health
You can enable on your Applications, Web Apps or Sites over the BrowserJS Integration, in conjunction with Source Code Maps, Live Session reply and can nail issues visually based on users session down and see the not only the errors from Browser Console, but also where it and to which Code Fragment it happens.
Session Replay shall be active only on Development Environment, even you can mask sensitive datas, its a tool to develop and not for Production Environments.
¶ SDKs
- BrowserJS
- Elixir
- Golang
- Java
- Next.js
- Nuxt.js
- Node.js
- Deni
- Phyton
- React Native
- Ruby on Rails
¶ Platforms
- AWS Cloudwatch
- AWS EC2
- AWS EC3
- AWS Lambda
- AWS SNS
- Cloudflare Workers
- Docker/Docker Compose
- Fly.io
- Heroku
- Kubernetes
- PVY@Cloud
- PVYflare
- Vercel
¶ Data Collectors
- Fluentd
- Open Telemetry
- Vector (datahoq)
- SysLog
- Fluent Bit
For OpenTelemtry you can use OpenTelemtry SDK or available OpenTelemtry Collectors and specify the Endpoint to PVYapplytics.
¶ Integrations
- PVY-ID SSO
- Javascript Source Maps
- Pagerduty
- PVYAutomat
- PVYflare
¶ API
- Managing Alerts
- Managing Dashboards
- Querying Chart Data
¶ PVY@Cloud vs PVY@Office
PVY@Cloud is a Personal Cloud Environment hosted in our own Swiss Datacenter where PVY@Office Appliances runs on Customer Location (on premise). It is available on its built-in PVYappstore and runs either in Datacenter or locally on Appliance. In Conjunction with PVYflare, where you can deploy any additional application you like, you can automate Appylitics beside of PVYcaptcha on each deployment, which saves you a bunch of time.
¶ How PVYapplytic compares to Datahoq and others?
We are glad you ask about. PVYapplytics is top notch, with new code base developed betweend 2022 and 2024. It eats much less storage than convential solutions and that makes the solution also for Startups affordable.
It’s using 80% less resources as a comparable Elastic-Kibana Stack or Graylog Enterprise in comparisation. For sure, great solutions too.
¶ Built for Purpose - Dev&Ops
PVYapplytics has been developed primary for Developers and Service Orchestration Monitoring. For sure you can have real time metrics and build nice and meaningful Dashboards with no to little efforts.
¶ Not a typical IT Infrastructure Monitoring Solution
Its not made for Bare Metal IT Infrasture Monitoring, even you can ship SysLogs from Switches, Routers and Clusters. For this we recommend, what we use our self as companion: CheckMK But you can achieve “Consumption Monitoring” for example and orchestrate these values for billing purposes over API.
¶ But its great for CyberSecurity
If you know what to look for, PVYapplytics can be a useful dedector for abnomalies.
¶ Used Open Source Technologies
As in all PVYapps, Open source stacks has been utilised with some talented developers, both inhouse and external stakeholders. Frontend is based on NextJS, where Database and Search Indexes has been optimized for Clickhouse DBMS.
¶ Read the Docs
API & Integrations
¶ How we use it @PVY.siwss
We use it in Development and Preflight Stages on all of our Applications, to eliminate errors and bugs. And since it got usuable for us, it help us in a unparalled expierience to get the things done.
On our production apps, we do not use it, in fact no telememtry data at all is being sent back to us. Except for our own website.
¶ Privacy
By default, it does index or unveil any wrongly entered password linked to any user. And Privacy for users are truly respected. However, we can look up for failed Logins, seeing IP Addresses, and the status of failed Login attempt, and activated on some Web Applications, the User-ID caused the failed Login.